If you prefer to print out the whole supervision instruction, please find the pdf version in the section of supervision on RM03 Moodle page.
Supervision 1 (15 February, 2022)
Instructions
- Read through the instruction carefully. You may face problems if you overlook any of the steps.
- Remember to save the QGIS document regularly.
- When running tasks on QGIS, leave the settings as the default unless instructed.
Note: functions and filename arehighlightedin this document.
Supervision overview
In this exercise, you will familiarise yourself with the basic features of QGIS software and geoprocessing exercises with vector data and raster data.
Setup Work Environment (10 mins)
- Please download and install
QGIS standalone install version(Long term release repository, Version 3.10) according to your platform: QGIS Download Page. - It is suggested to create a folder and name it as
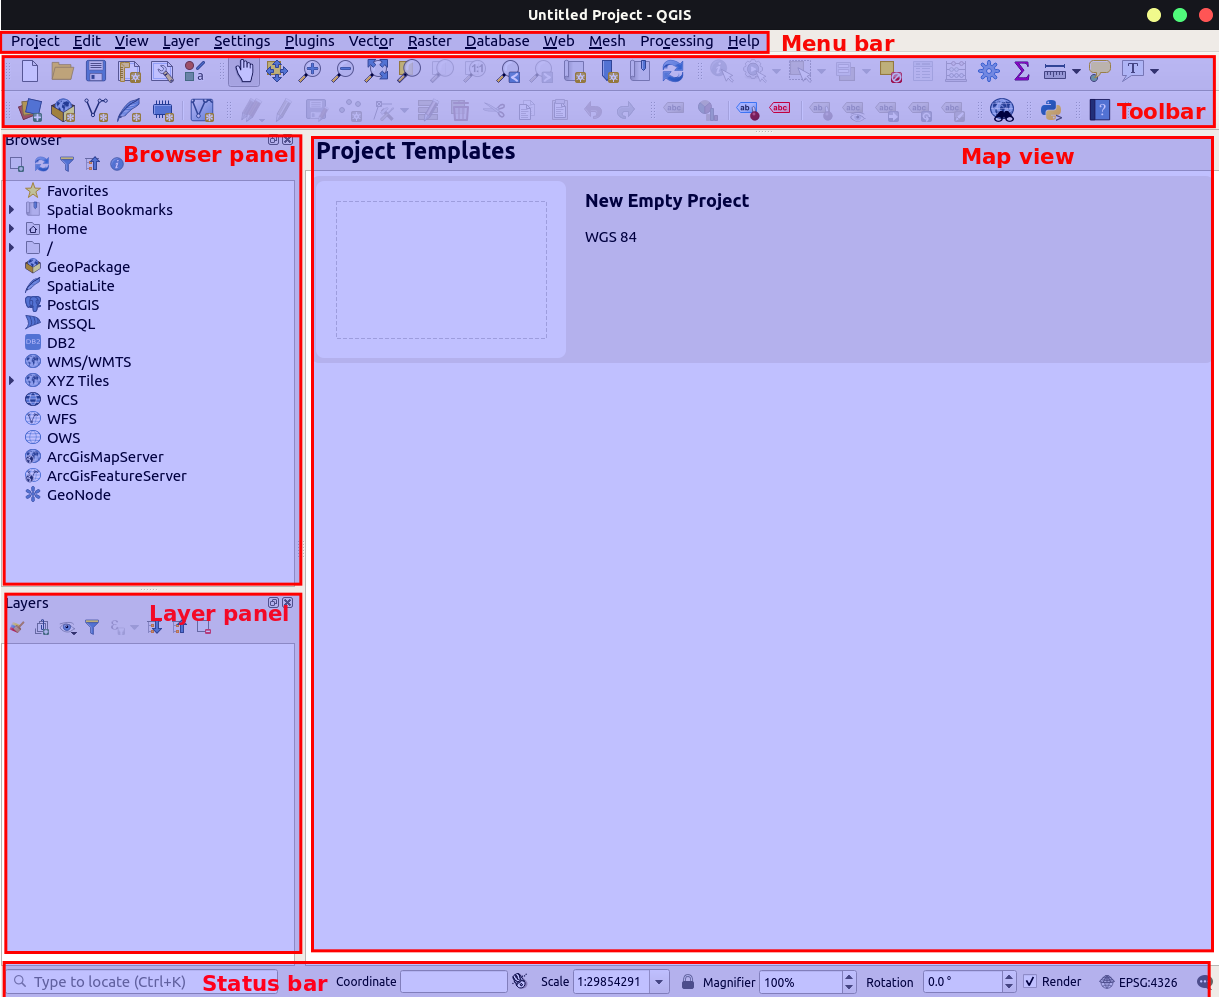
rm03_YourCRSid_sup1, at your prefered directory on your disk. This folder will be the working directory for all datasets and QGIS project file in this supervision. - Launch QGIS: Start QGIS Desktop and check interface (menu bar, toolbar, browser panel, layer panel and map window)
Note: if some panels or toolbars are not showing, navigate to menu barView>PanelsorToolbarsto switch on.
QGIS Project Setup (5 mins)
- In the menu bar, Click
Project>Newto create a new QGIS project. - Go to
Project>Save Asand save assupervision1.QGZto the working directory. - Go to
Project>Propertiesand open theProject Propertieswindow.
-
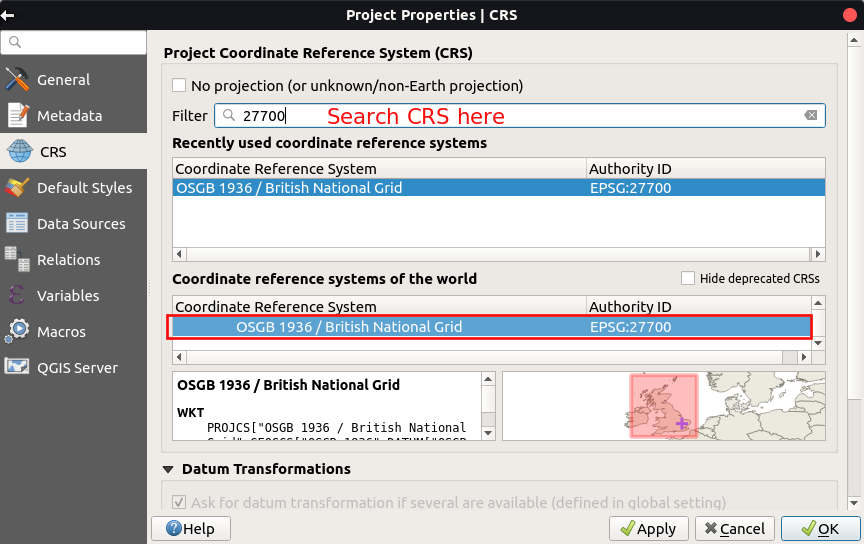
CRStab: this tab provides the Coordinate Reference System (CRS) setting for the project file. Here, we choose the projected coordinate system,OSGB 1936/British National Grid EPSG:27700. ClipApplybutton in the left bottom corner. Be aware that CRS setting in theProject Properties(calledData Frame settingin ArcGIS) is just for the project file, not including layer CRS. CRS setting for layers will be introduced later. -
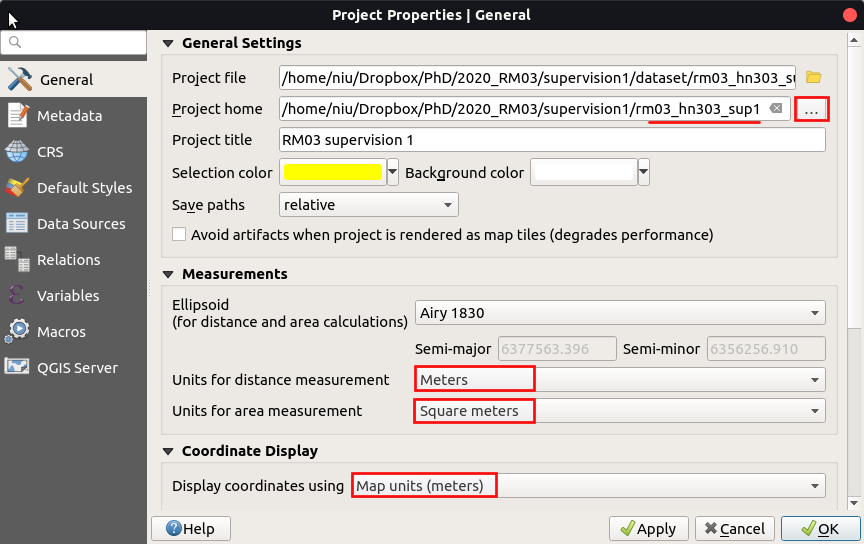
Generaltab: in the general settings, set your working directory asProject Home, change the unit for distance measurement asMeterssince we choose projected CRS (EPSG:27700) in the last step and set display coordinates units asMap units (meters). -
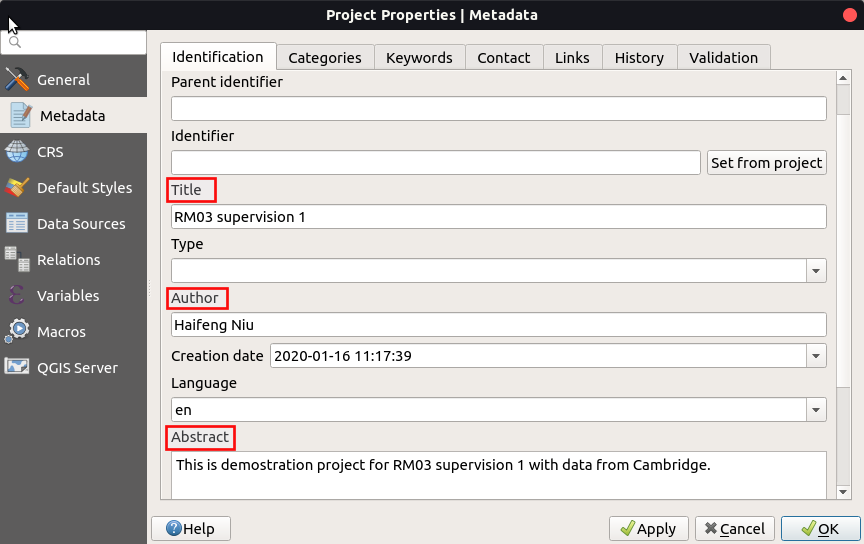
Metadatatab: It is suggested to input title, author, creation date and a short abstract in the identification tab.
Note: after adding Project home, you can find Project Home directory is showing in the Browser panel. It is much easier to locate your data files through the panel.
Vector Data (30 mins)
First, we will play with some vector data. In this part, you will learn:
- How to import shapefile into QGIS?
- How to activate a layer?
- Download
Cambridge District Wardsdata of Cambridgeshire from: Cambridgeshire Insight Open Data and save zip file into your working directory. - Import shapefile into your project: Locate this file at your working directory in the
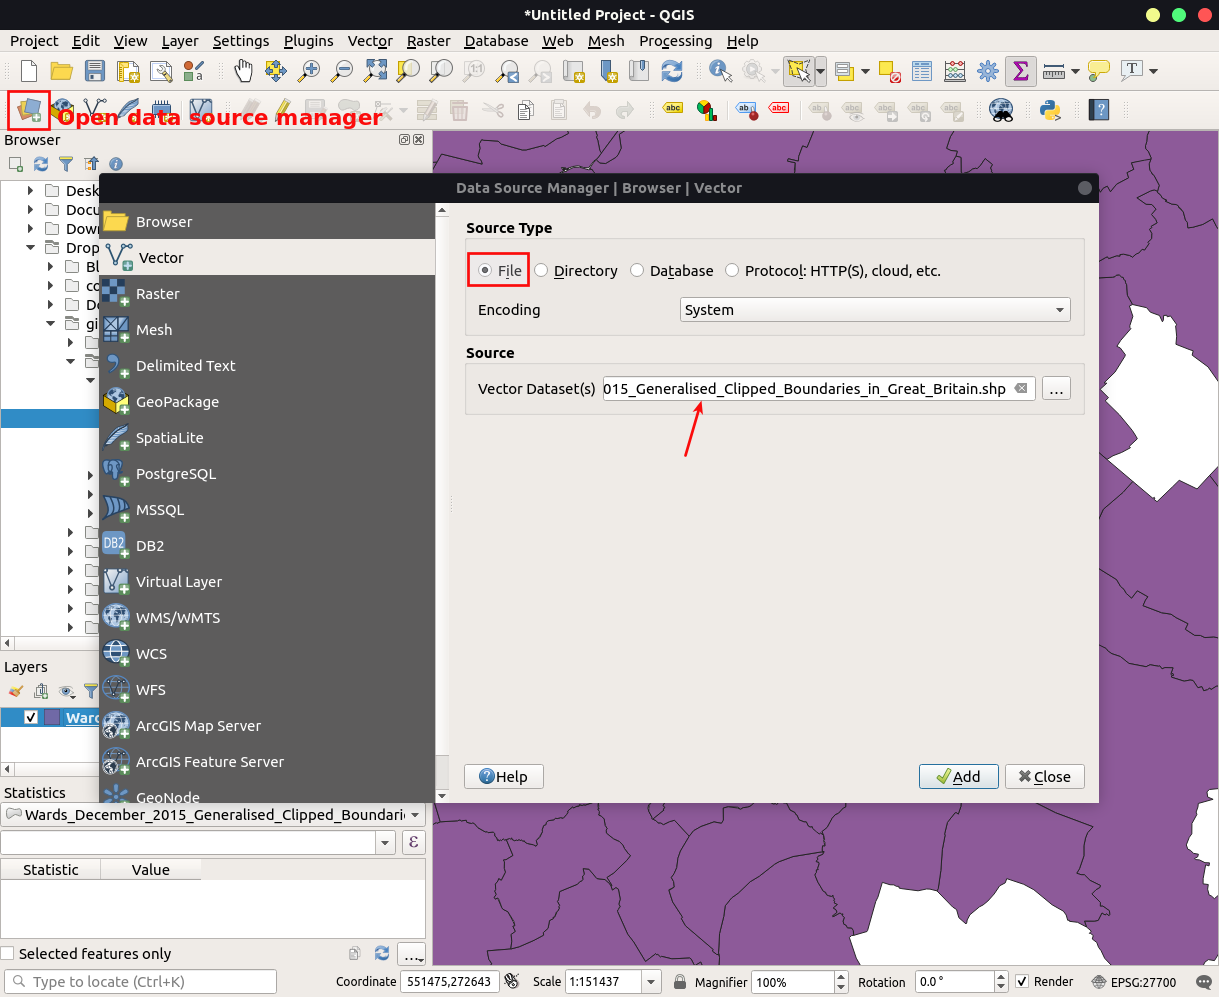
Browser Paneland hold the left mouse and drag theWards_December_2015_Generalised_Clipped_Boundaries_in_Great_Britain.shpinto the map window. Alternatively, you can add vector file through the data source manager. ClickOpen data source managerbutton onData source manager toolbarand switch toVectortab. Choose file as the source type and choose your shapefile in the source path.
Note: You may be prompted a window to conduct CRS transformation, click ok to continue.
3: Check added layer in Layer Panel. You can turn on and off layer by checking or unchecking it. Before you perform any action to a layer, please make sure the target layer is checked and selected with highlight.
Attributes table
- How to open the attribute table?
- How to select polygons only from Cambridge through the attribute table?
-
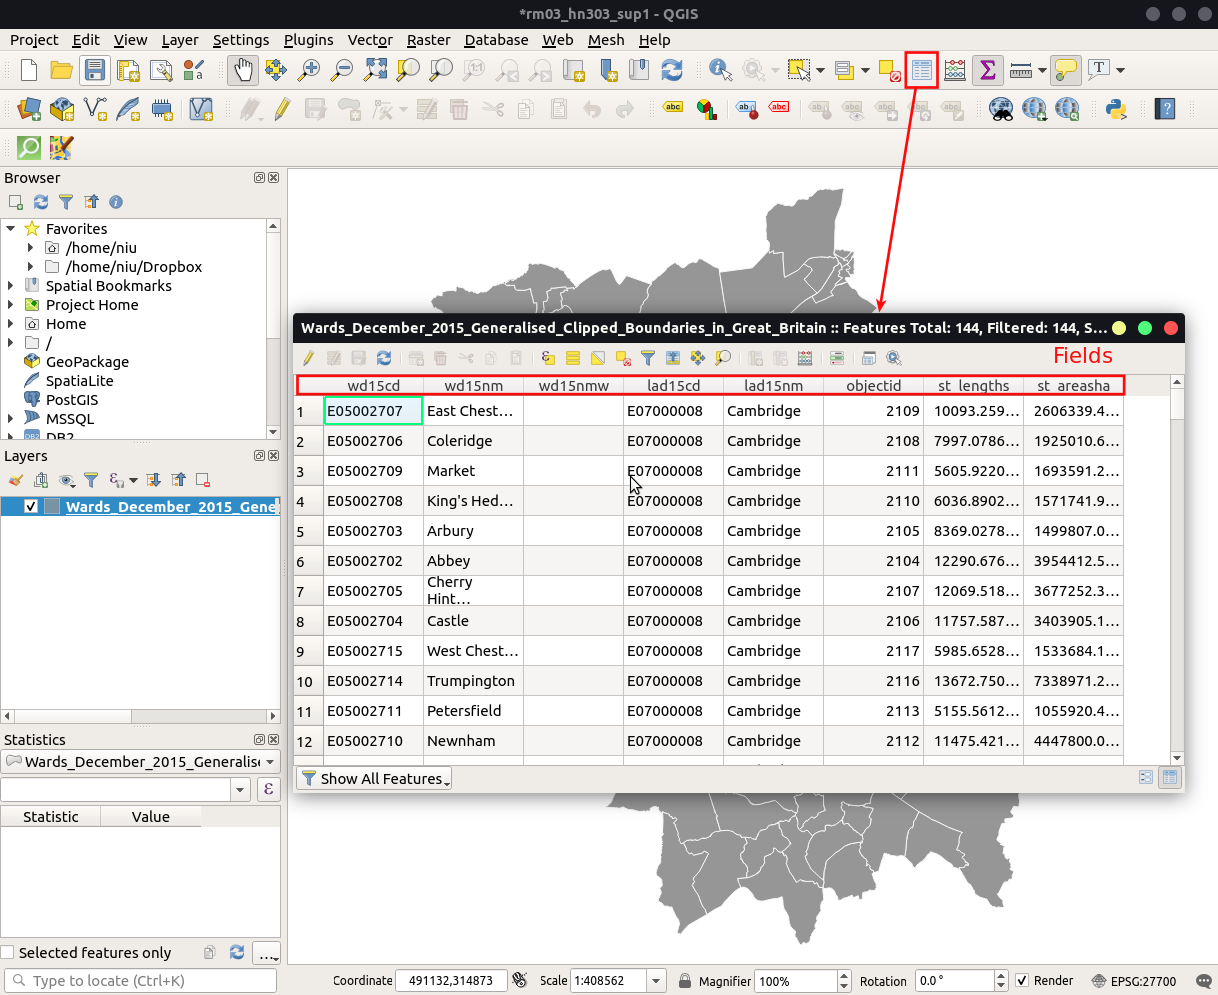
Select the layer in the layers panel, click the
open attribute tablein theAttribute Toolbar. You will see the attribute table with different fields includingwd15nm(the name of Ward District) andlad15nm(the name of Local Authority District).
-
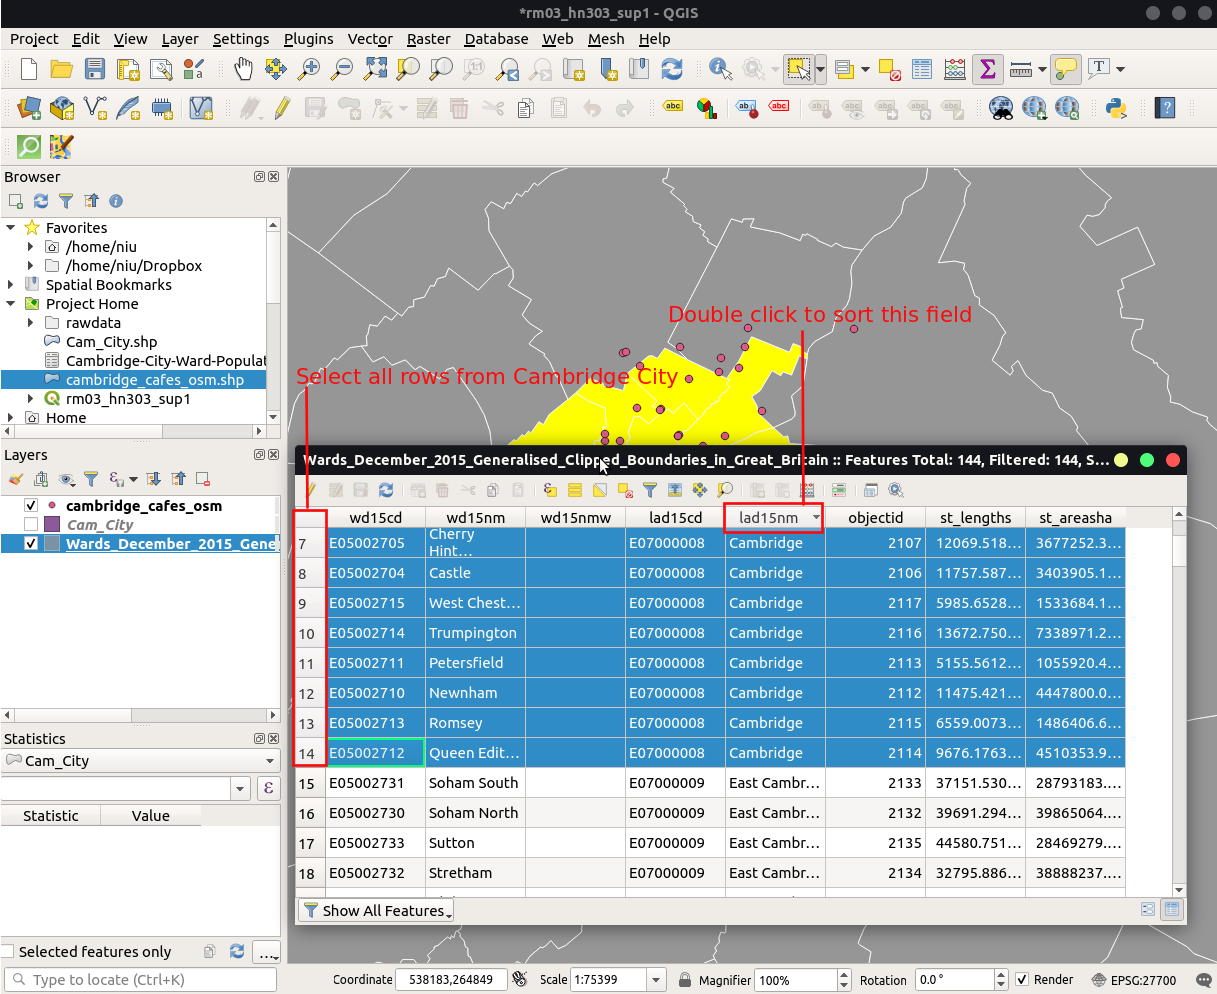
In the attribute table of the Cambridgeshire layer and double-click
lad15nmto sort by value/content. Select all rows whoselad15nmvalue equalCambridge(select first one and then press SHIFT on your keyboard while selecting the last one). The selected elements will be highlighted in the map view.
-
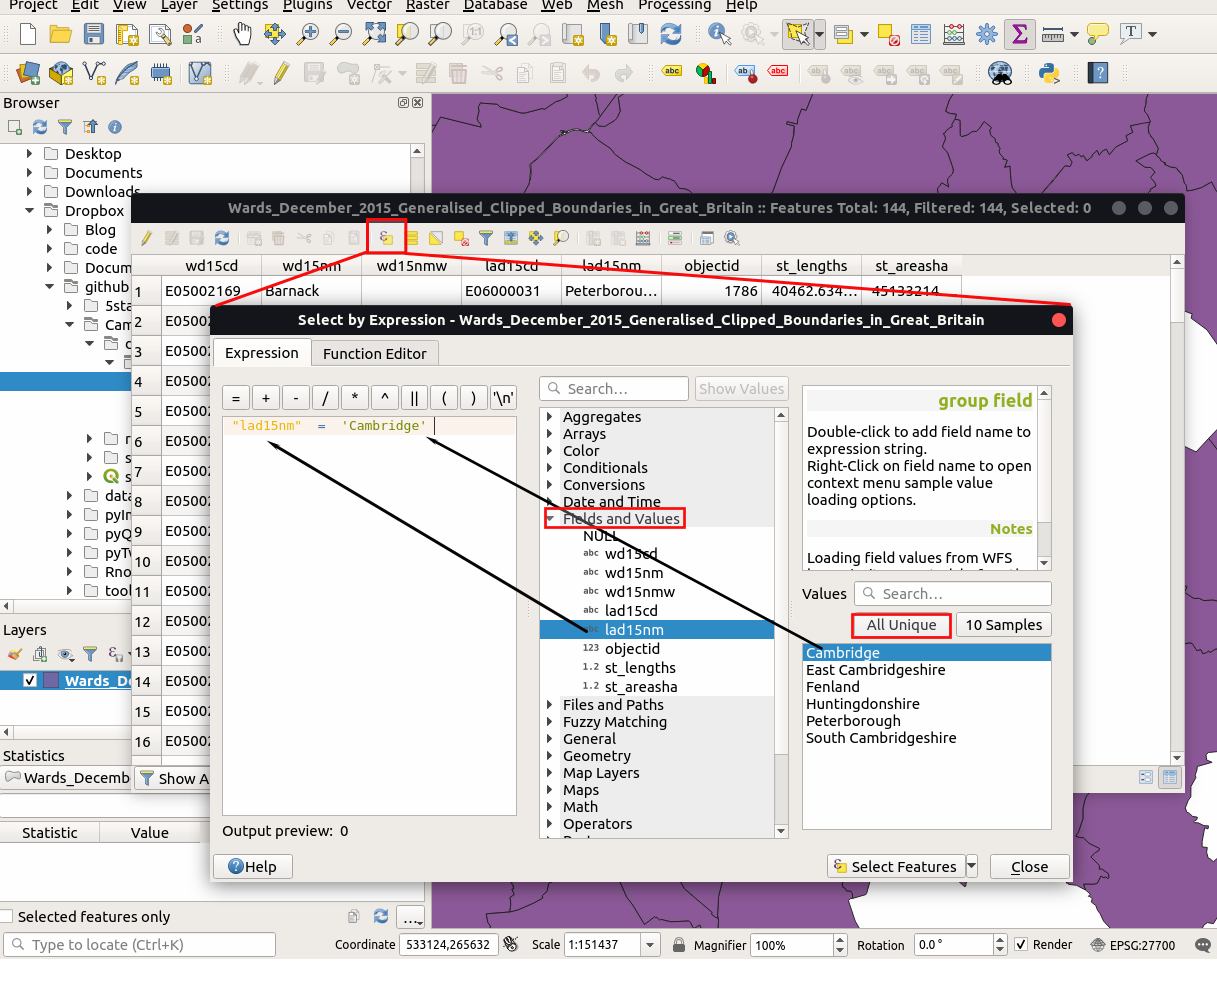
Here is an alternative method to select elements precisely: Open attribute table of Cambridgeshire layer and
Select features using an expressionin QGIS. In the window of expression, input"lad15nm" = 'Cambridge'and click select features.
Note: You don’t need to type expression manually, expandField and Valuesoption in the right panel and double clicklad15nm. The field name will show in the expression window. Once you select the fieldlad15nm, clickAll Uniquebutton on the right, it will show a list of unique values from the field oflad15nm. Double click it to add to your expression.
-
Once select elements you need, right-click this layer and click
Export>Save Selected Features As. First, change the format toESRI Shapefile. Then, you need to click the ellipsis (...) button to select the output directory and name the file asCam_City. This exported shapefile should include these wards: Abbey, Arbury, Castle, Cherry Hinton, Coleridge, East Chesterton, King’s Hedges, Market, Newnham, Petersfield, Queen Edith’s, Romsey, Trumpington and West Chesterton. -
Try other functions in attribute table:
select all,invert selection,deselect all
Importing spreadsheets or CSV files
- How to import data from spreadsheets and CSV with coordinates?
- How to display coordinates from spreadsheets and CSV in QGIS?
- Download
Cambridge local servicesdata of Cambridgeshire from: Cambridgeshire Insight Open Data and save into your working directory. (If you are using Safari on MacOS, you need to clickdownload>right clickin the pop-up window > save page as a csv file.) This is a dataset to be used to geo-locate a shortlist of agencies and facilities around Cambridge. - Navigate to menu bar click
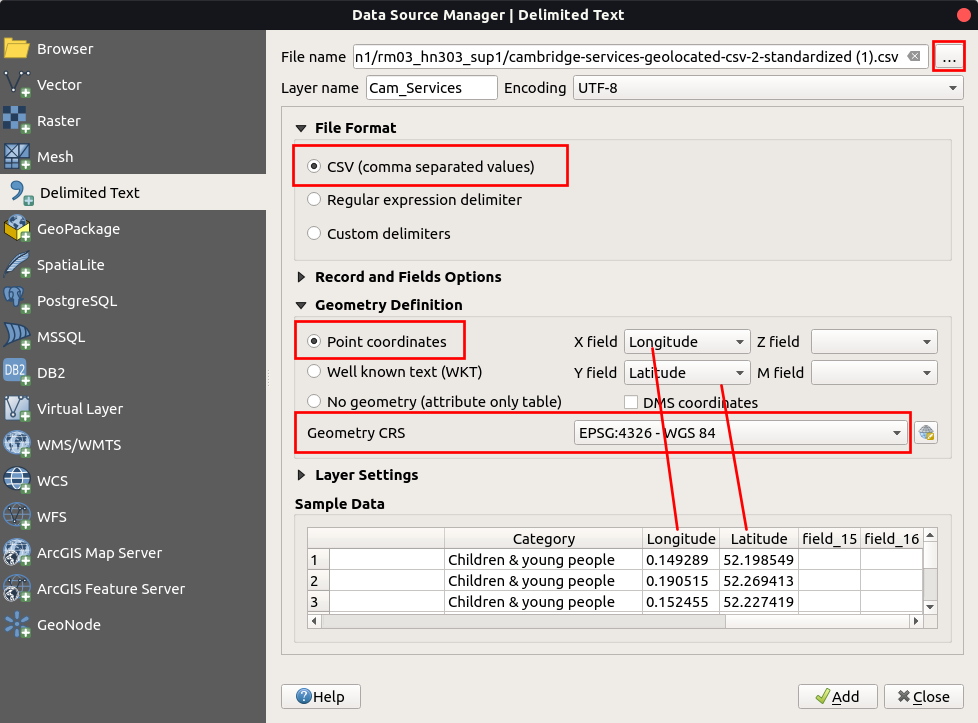
Layer>Add Layer>Add Delimited Text Layer. Browse thecambridge-services-geolocated-csv-2-standardized.csvjust downloaded and change the layer name toCam_Services. In the section of File Format, choose CSV. In the Geometry Definition section, choosePoint coordinatesand selectLongitudeandLatitudefields as X Y fields respectively. Normally the Geometry definition section will be auto-populated if it finds a suitable X and Y coordinate fields. Then choose the right CRS (EPSG:4326 - WGS84) for this file. Finally, clickAdd, and you will find a point layer.
Join layer
- How can we link Cambridge local services with district information?
-
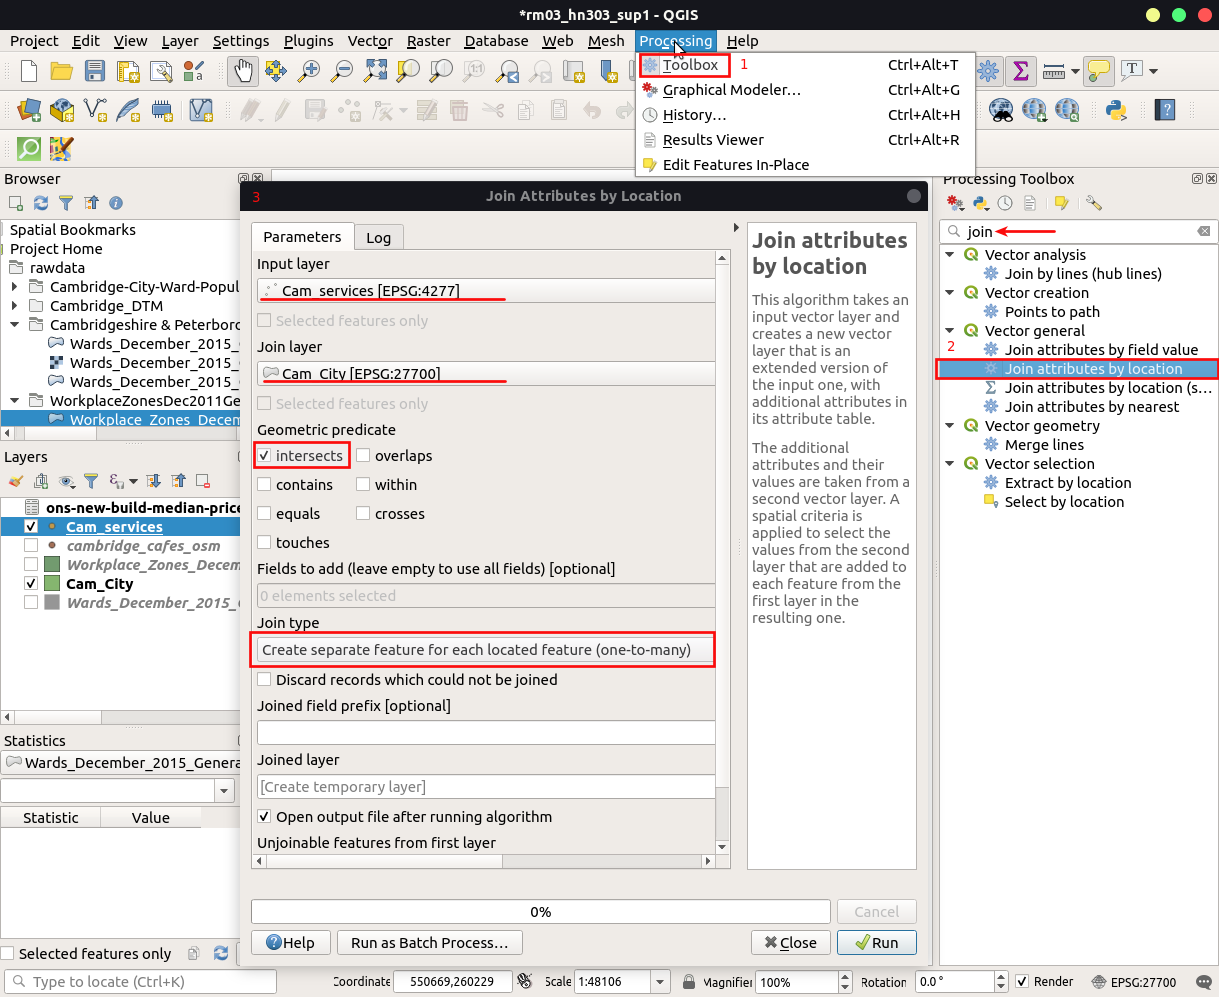
Navigate to
Processing>Toolboxand searchJoin attributes by location. In the prompted window, chooseCam_Servicesas input layer andCam_Cityas join layer. In the geometric predicate section, chooseintersects. In the join type section, choosecreate separate feature for each located feature (one-to-many).
-
Open the attribute table of
Joined layer, and you will find district information for each service item.
Digitizing Map Data (15 mins)
- How to install a plugin in QGIS?
- How to add a base map to QGIS?
- How to create a new shapefile?
- How to add new features with attributes?
Basemap and plugins in QGIS
-
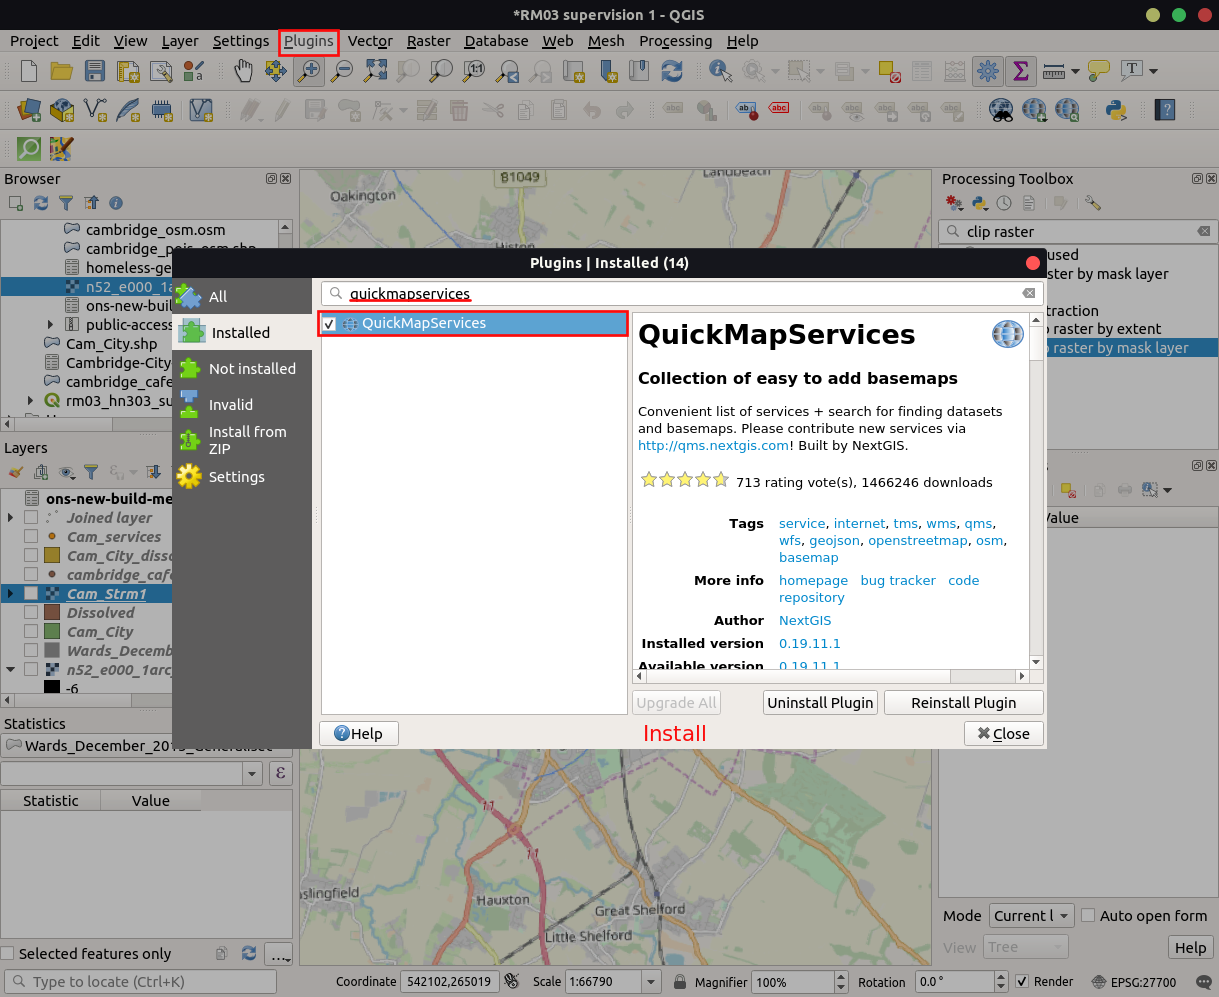
Extend functions of your QGIS with plugins: open
Plugins>Manage and Install Pluginsfrom the menu bar. SearchQuickMapServicesand clickInstall plugin.
Note: if some plugins are not showing, please switch toSetting taband turn on theShow also experimental pluginsoption.
-
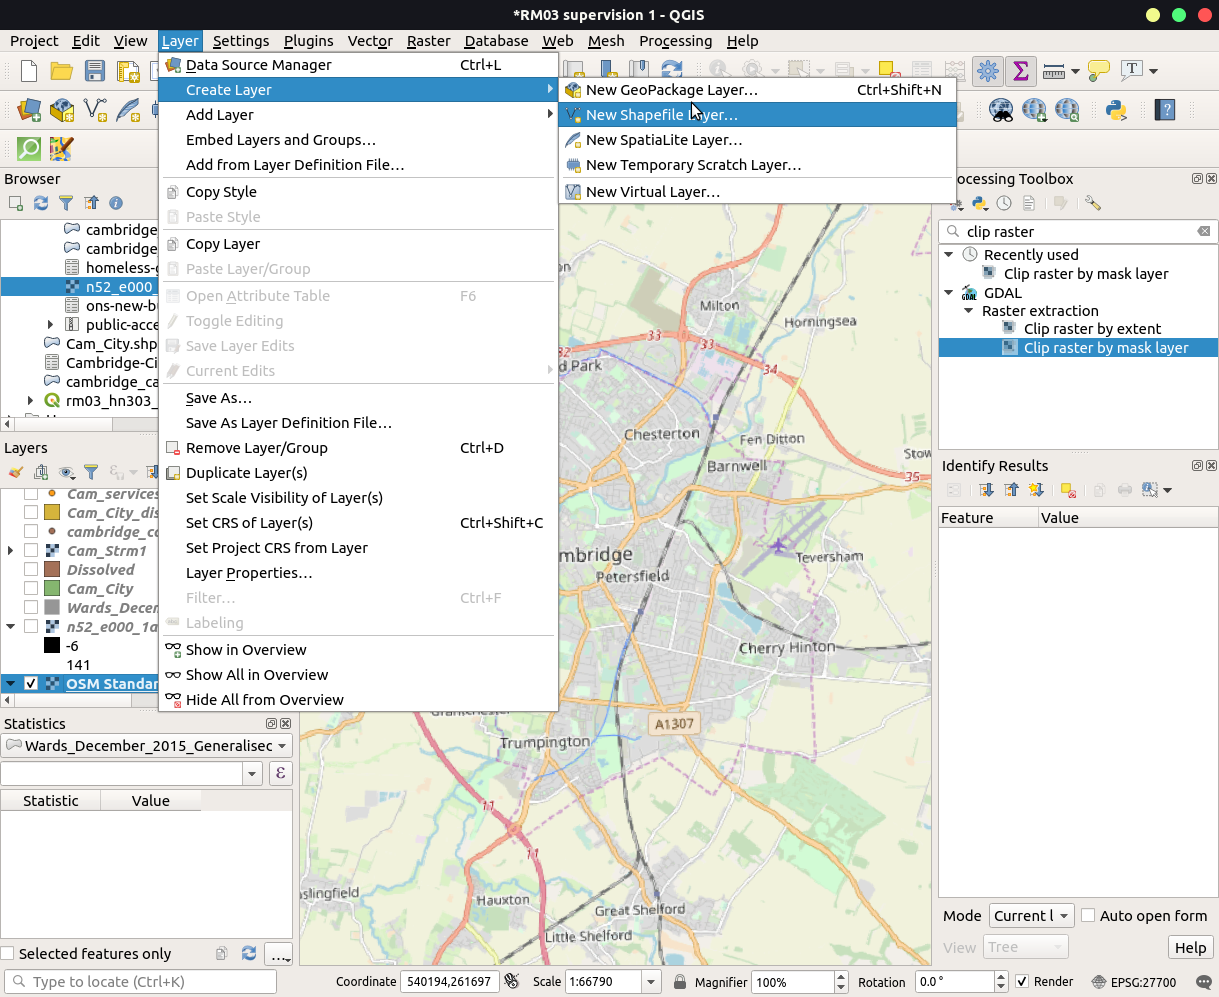
After installing the plugin, you can find
QuickMapServicesfunction in theWebsection from the menu bar. ChooseOSM-OSM Standard, and you will add a base map in QGIS.
Create features/shapefiles in QGIS
- Once you add a base map for your QGIS project, you will see a scalable map in the map window.
Note: You computer must be connected to the internet to add base map as the imagery is fetched from web servers. - Zoom in to the Cambridge area to find the location of your frequently visited services including cafes, restaurants, book shops, cash machines, etc. If you are not familiar with the Cambridge city due to the COVID-19, please try to find our department and your college on the map and explore the surroundings.
-
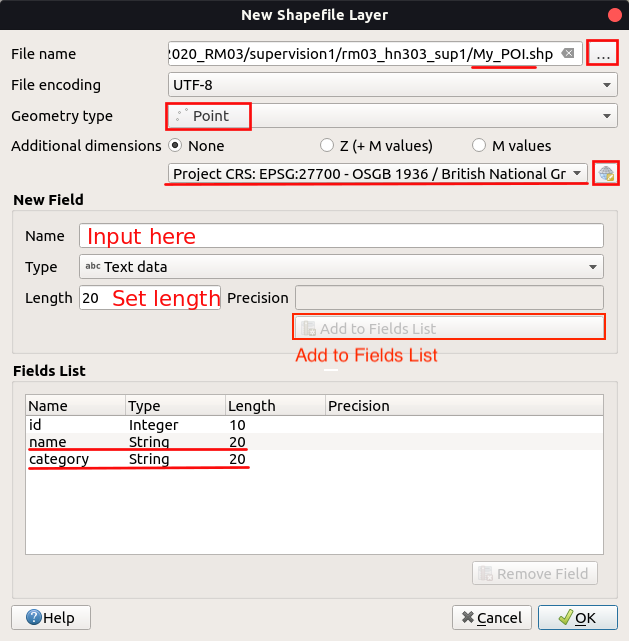
Create the following three shapefiles using
Layer>Create Layer>New Shapefile Layer. You need to click the ellipsis (...) button to select the output directory and name the file asMy_POI.shp(Point). Remember to choose theEPSG:27700 - OSGB 1936 / British National Gridcoordinate system (select CRS > filter > SearchOSGB 1936). You will add twoNew Fields(nameandcategory) to itsFields Listto store the name and category of each POI.
-
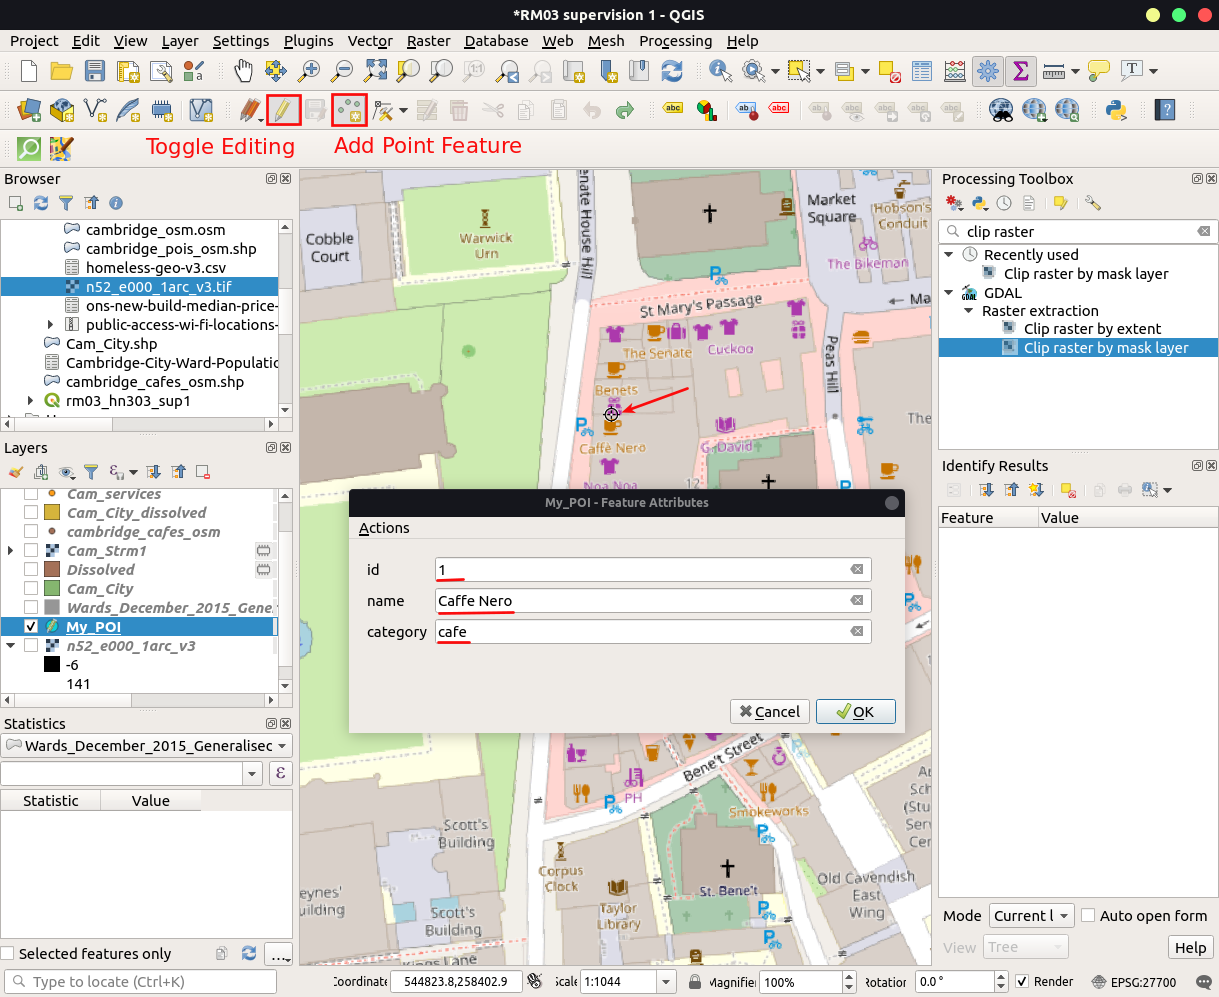
Select the
My_POIlayer in the layer panel, then openToggle editingand selectAdd Point Feature. After pining a point feature on map window, aFeature Attributewindow will pop up. Input id, name and category (cafe, restaurant, book shop, etc.) of this new feature.
-
After creating features in the map window, click
Toggle Editingagain and save changes. - Repeat above step from 4 to 5. Create another 4 points with inputting attributes.
Raster Data (10 mins)
Now, you will take a few mins to families the raster data. In this part, you will learn:
- How to import raster data?
- How to extract part of raster in Cambridge?
- How to symbolise raster map?
-
Download
Cambridge SRTM1data of Cambridgeshire from: Cambridge SRTM1 Data into your working directory. This dataset is used to generate digital elevation data and make a topographic map. -
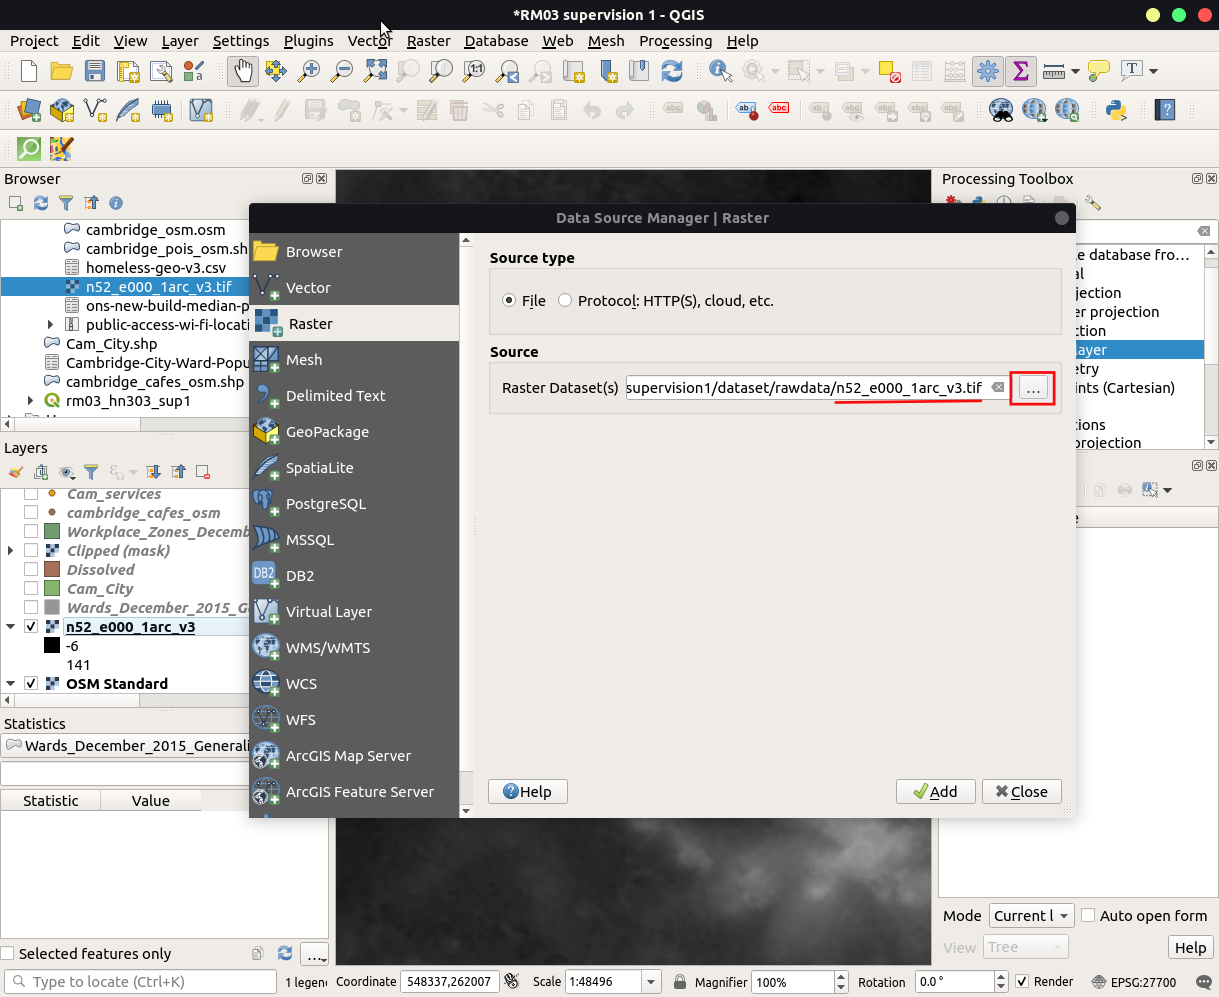
Import shapefile into your project: Locate this file at your working directory through
Browser Paneland hold the left mouse and drag then52_e000_1arc_v3.tifinto the map window. Or, you can add vector file through data source manager.
-
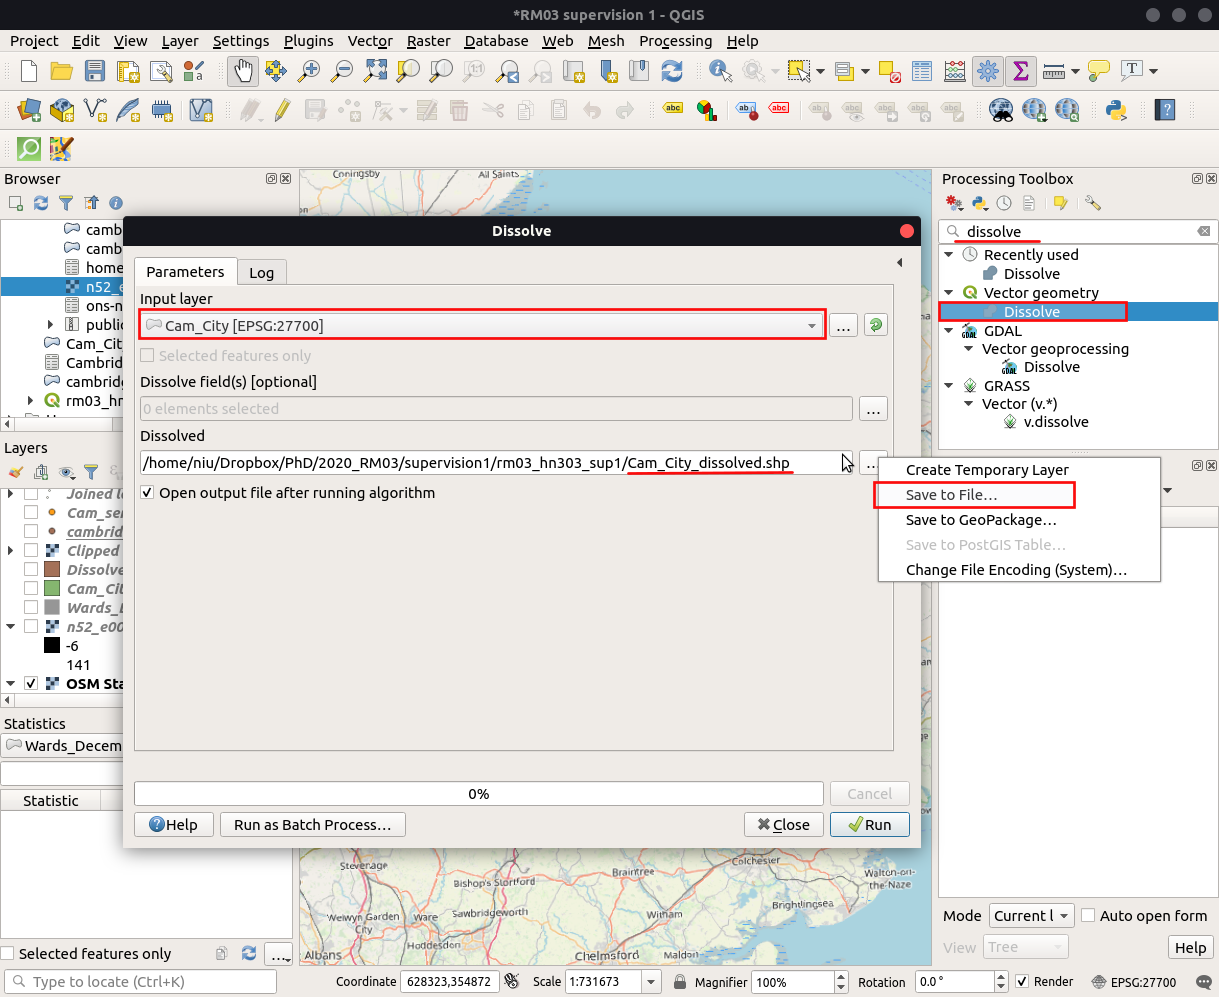
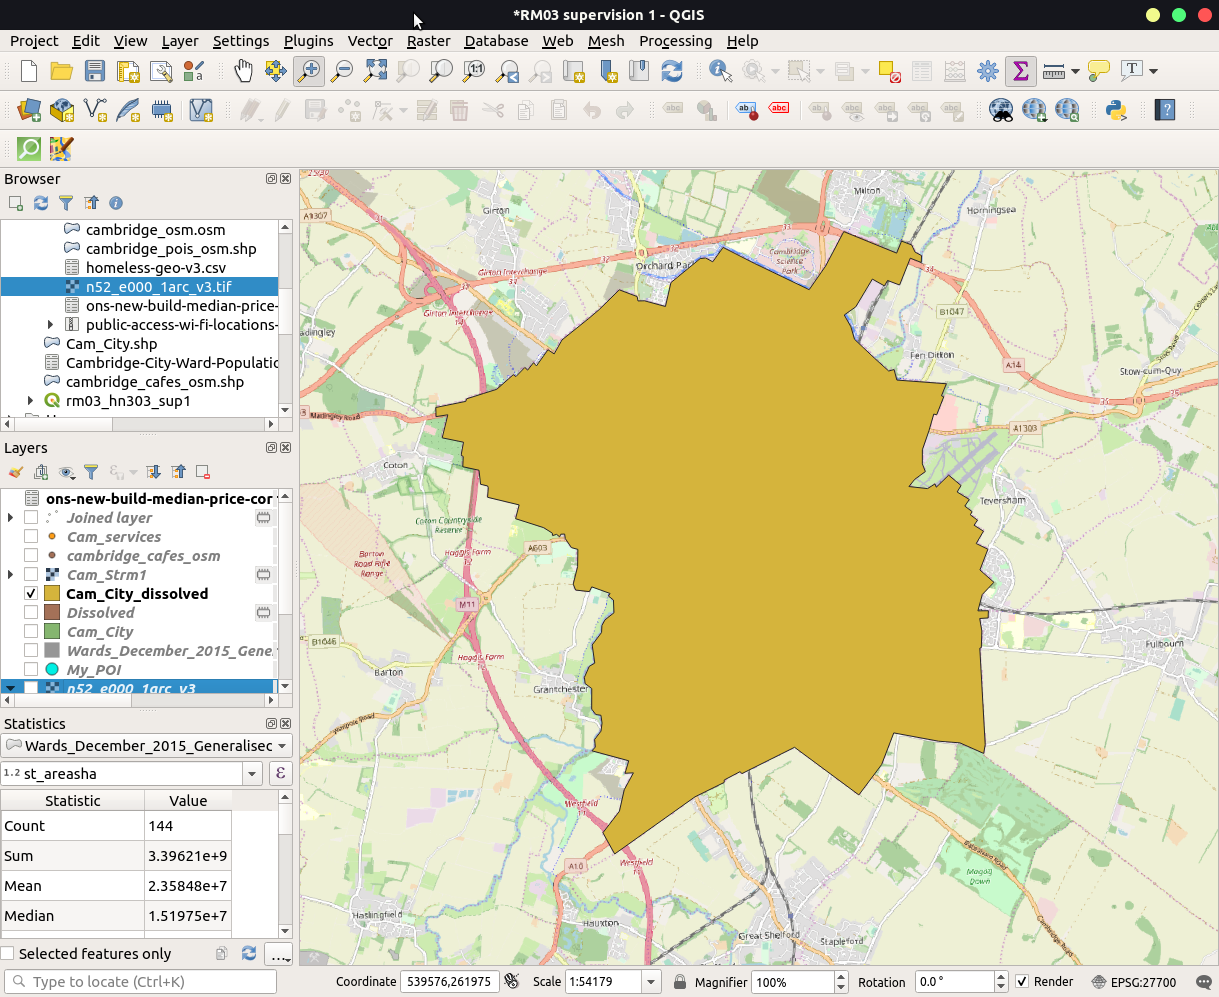
Before extracting from raster, we need an aggragated shapefile covering whole Cambridge city (called
mask layerin raster clipping). Navigate toProcessing>Toolboxand searchDissolveunderVector geometrysection. In the prompted window, chooseCam_Cityas input layer and save asCam_City_dissolved.shpto your working directory.
-
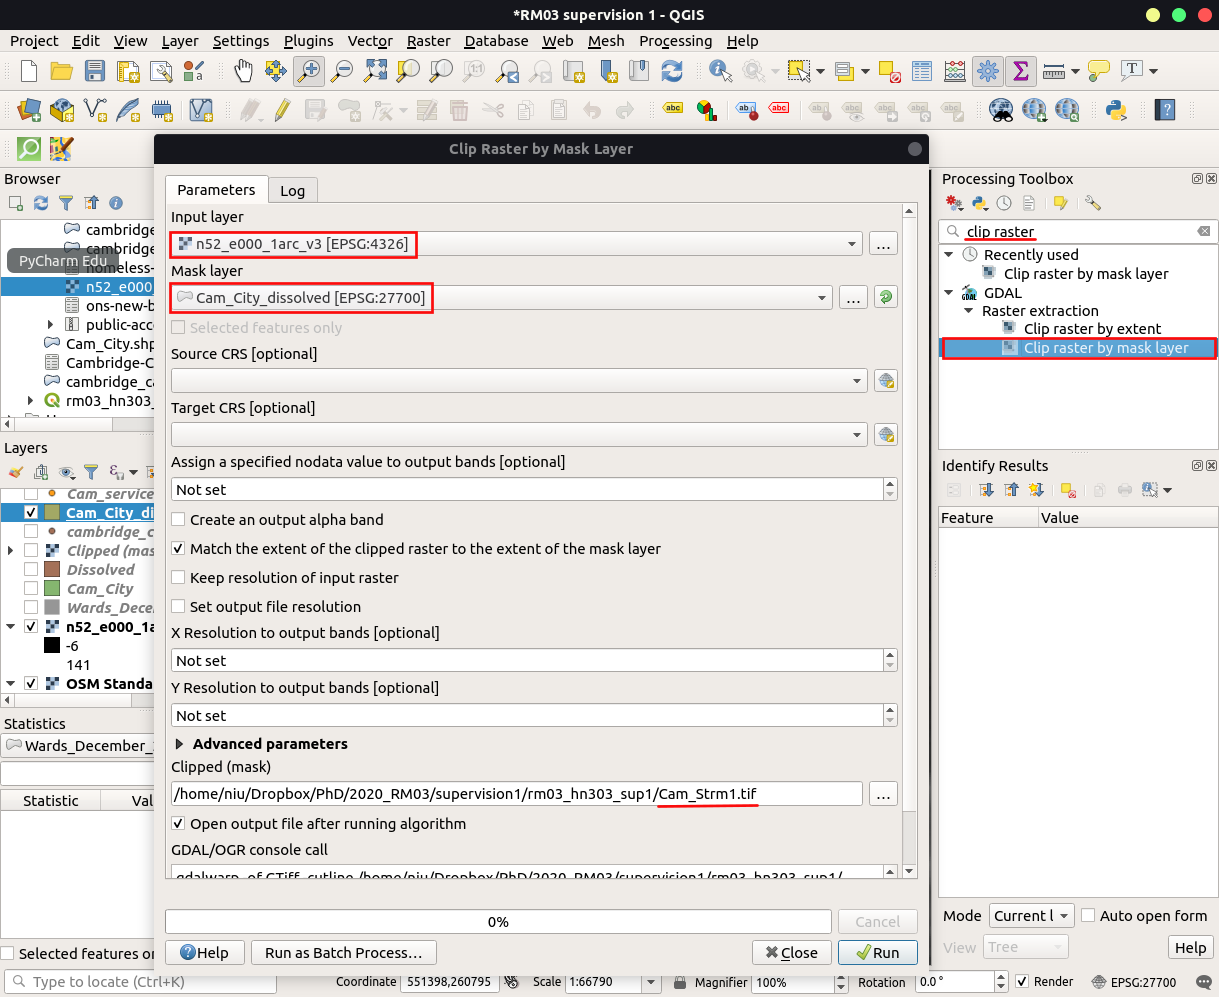
Navigate to
Processing>Toolboxand searchClip raster by mask layer. In the prompted window, choosen52_e000_1arc_v3.tifas input layer andCam_City_dissolvedas a mask layer. Save extracted raster asCam_Strm1.tif.
-
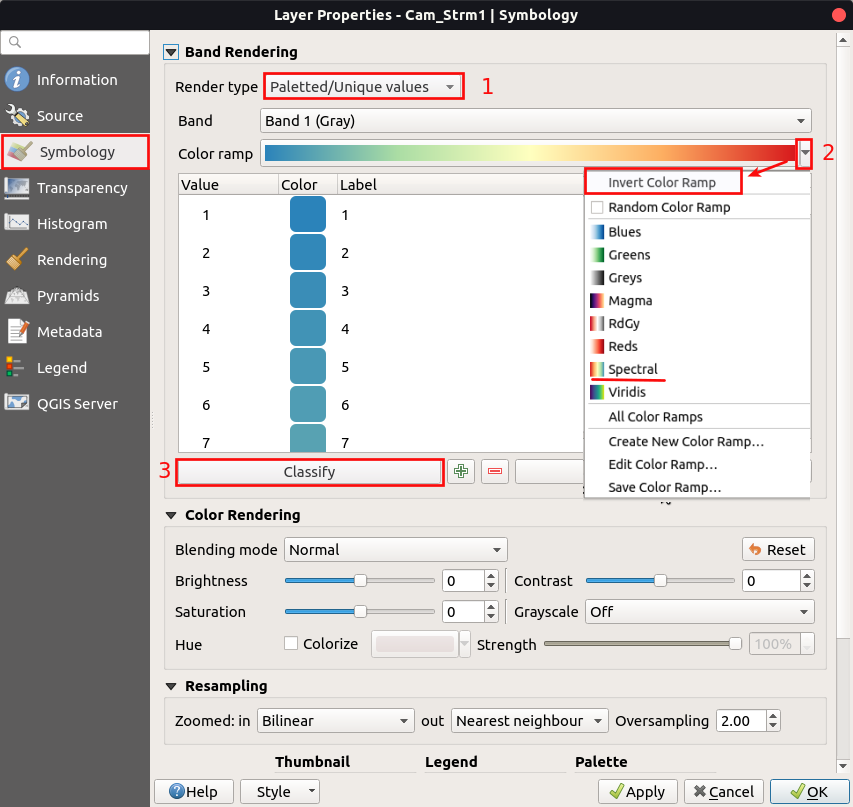
Change symbology: Select
Cam_Strm1.tifand right-click to the properties option. Switch toSymbologytab and changeRender typetoPaletted/Unique values. Expand theColor rampsection and chooseSpectral. Then clickClassifybutton to automatically assign a colour to each value. Back toColor rampsection and checkInvert Color Rampoption.
Note: if your layer is not showing, change the order of layers inLayer Panel.
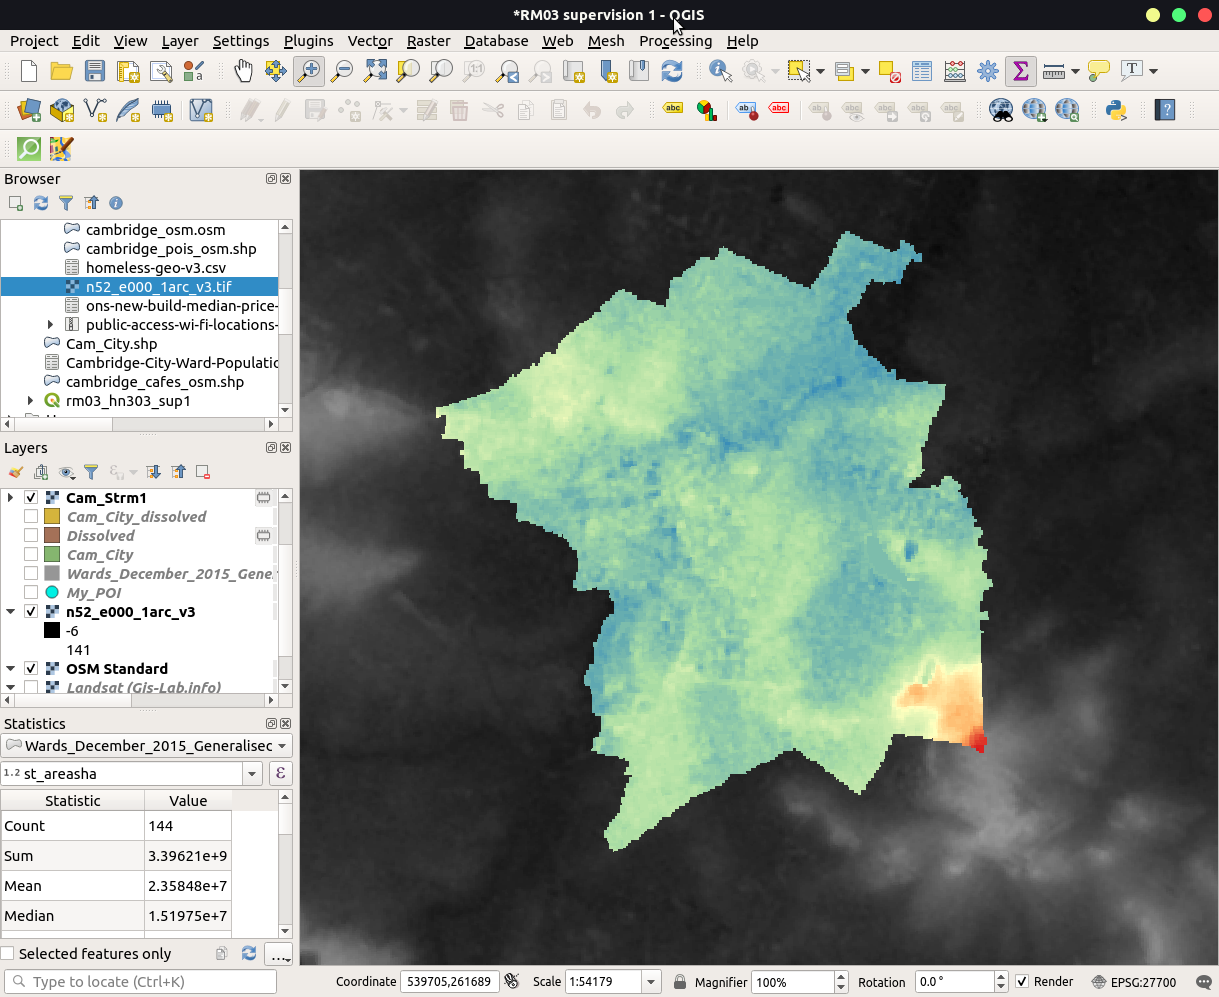
-
Now you have a topographic map about Cambridge city. You can compare your result with Camrbidge Terrain Map