If you prefer to print out the whole document, please find the pdf version in the section of supervision on RM03 Moodle page.
Assignment for Supervision 1
Submission Dealine: 24 Feb (Tuesday) 12:00pm, 2021
Instructions
- Please download and install QGIS standalone install version according to your platform: Download QGIS
- Read through the tasks carefully. You may face problems if you overlook any of the steps.
- Remember to save the QGIS document regularly.
- Read through the instruction carefully. You may face problems if you overlook any of the steps.
- Please write your answers in a new blank word document and submit on Moodle. \
Note: functions and filename are highlighted in this document.
Assignment overview
In this assignment, you will extract the wards in the Cambridge city area using the Cambridgeshire data. After that, you will link the population data to the respective wards, and compute the population density of each ward. Lastly, you will symbolize population density in Cambridge.
Tasks
-
Download
Cambridge District Wardsdata of Cambridgeshire from Cambridgeshire Insight Open Data and import the shapefile into QGIS.
Hint: set up project properties includingCRS. -
By using
Select featuresorSelect features using an expressionto create a new shapefile for the wards of Cambridge City. This shapefile will include these wards: Abbey, Arbury, Castle, Cherry Hinton, Coleridge, East Chesterton, King’s Hedges, Market, Newnham, Petersfield, Queen Edith’s, Romsey, Trumpington and West Chesterton. Name this file asCam_City.shpwith choosing CRS EPSG:27700.
Hint: UseSelect featuresorSelection using expressioncommand to export the data to a new shapefile.
-
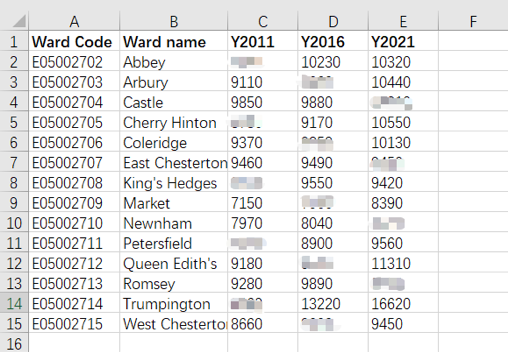
Download Cambridge population estimates data(2015) from: 2015-based population forecasts for Cambridge
-
Open it in excel and comprise only one sheet, containing five columns, Ward Code, Ward name, Y2011, Y2016 and Y2021.
-
Import the CSV file into QGIS.
Hint: drag file into QGIS or add csv throughData Source Manager.
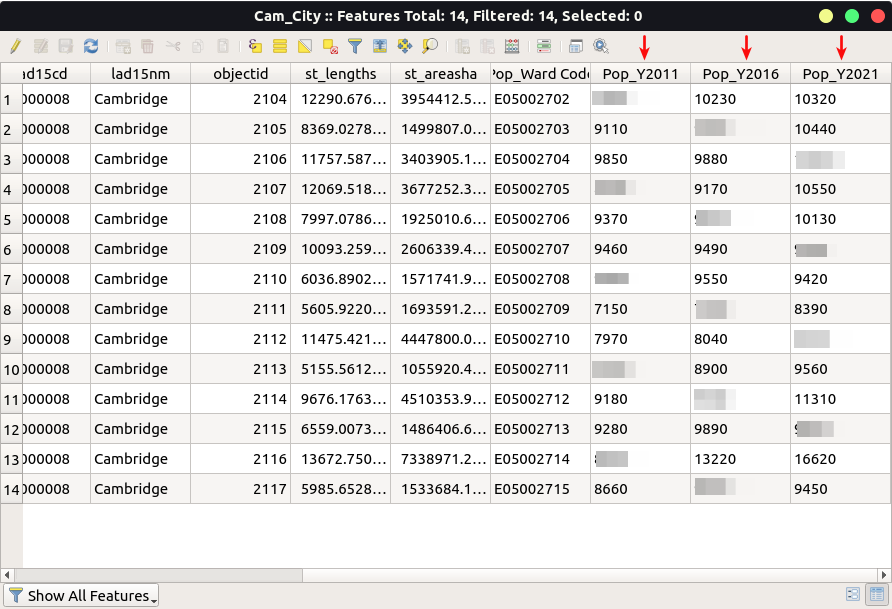
Question A: Which ward has the highest and lowest population in 2011, 2016 and 2021? Tabulate and also write respective population.
-
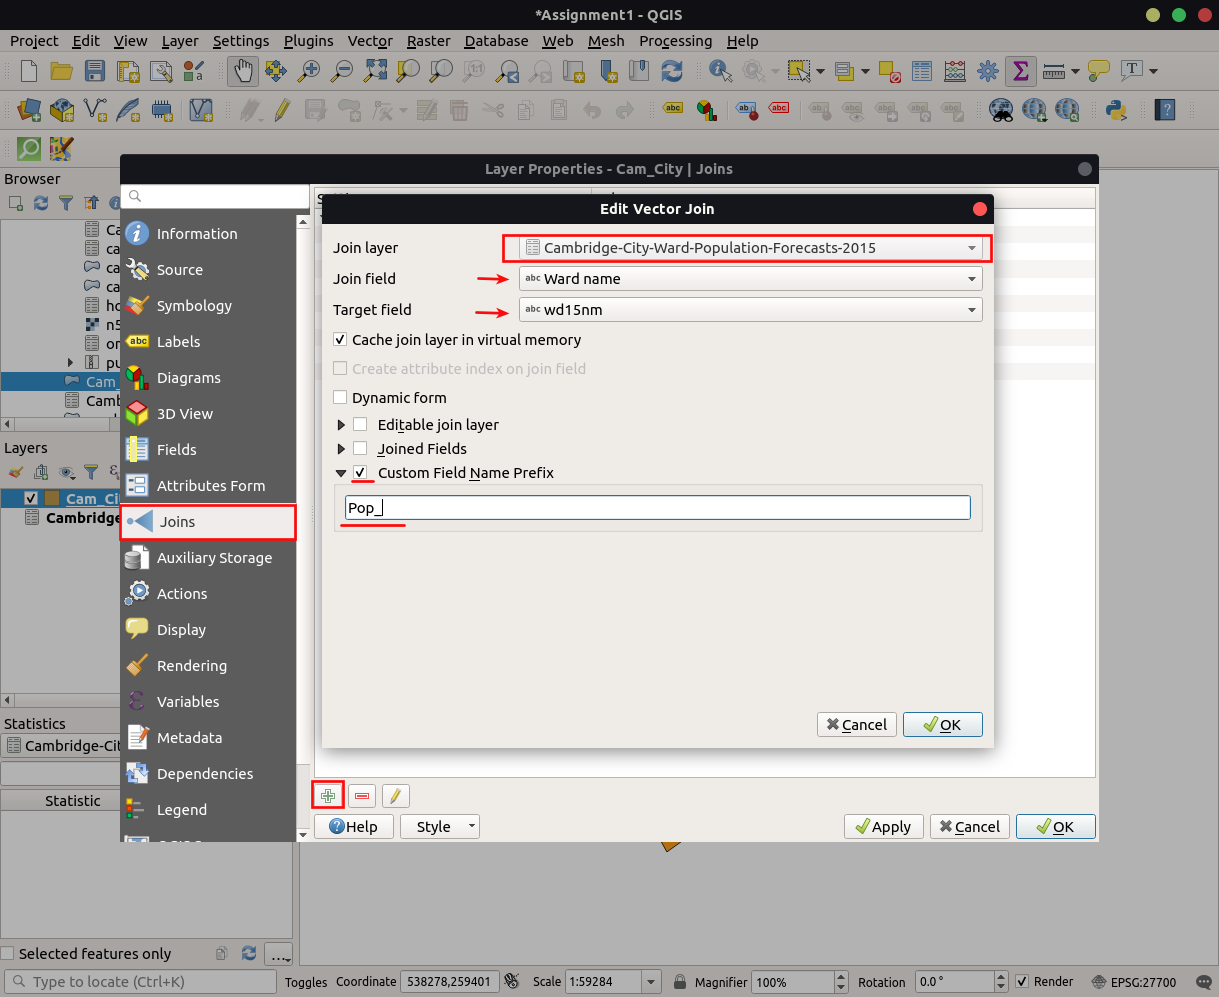
Right-click the
Cam_Cityand click thePropertiesoption. Switch to theJoinssection on the side and click theAddbutton to join the population table2015-based population forecasts for Cambridgeto theCam_Cityshapefile. SelectWard nameas Join field andwd15nmas Target field. Once this is done, the Attribute Table ofCam_Cityshapefile should show the Ward name and the population of each ward in 2011, 2016 and 2021.
-
Use the
Exportcommand to create a new shapefile, name it asCam_City_Pop.shp. The Attribute Table of this shapefile must be showing the ward names as well as the corresponding population in 2011, 2016 and 2021. \ -
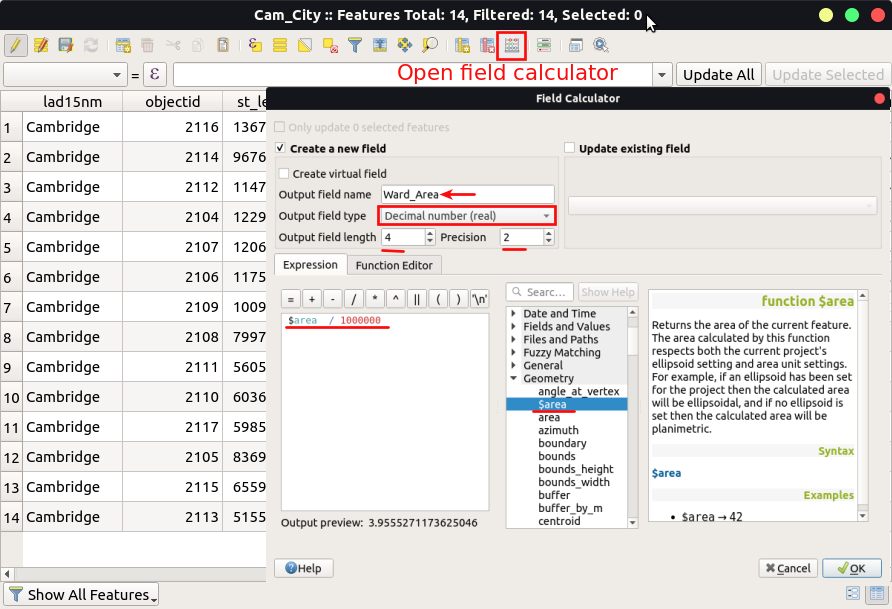
In the Attribute Table of
Cam_City_Popshapefile, clickOpen field calculator. Create a new field named asWard_Areaand set the output field type to ‘Decimal number (real)’, Precision = 4 and Scale = 2. In the expression window, input$area/1000000and it will compute the area for each ward in km2 (sq kilometres).
Note: you can find$areain the right list underGeometrysection.
Question B: Why did we use Decimal number as the data type while adding the field Ward_Area in the Attribute Table of Cam_City_Pop shapefile? What is the purpose of setting the Field langth and Precision values?
Question C: Which ward is the largest and smallest in terms of area? Also note their areas in km2.
- In the Attribute Table of
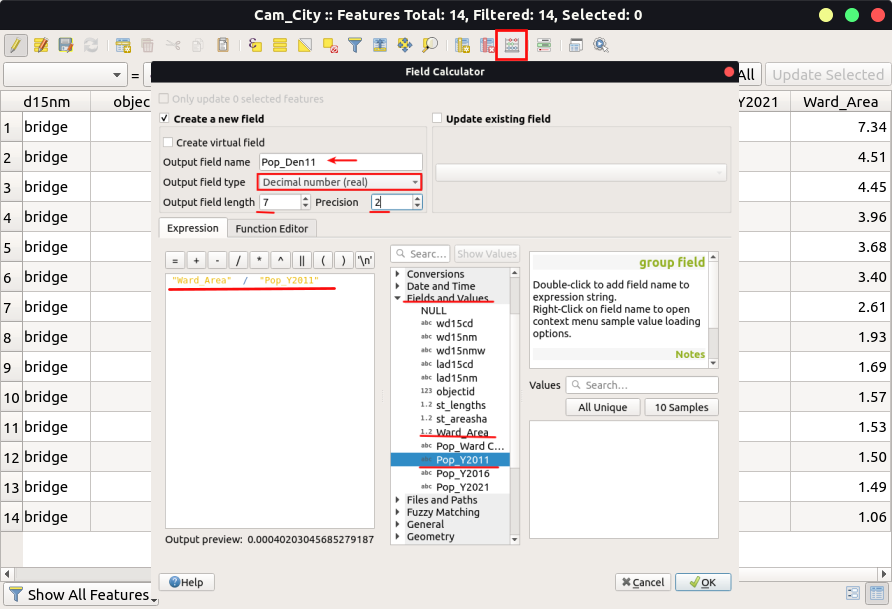
Cam_City_Popshapefile, clickOpen field calculator. Create another new field named asPop_Den11and set the output field type to ‘Decimal number (real)’, Precision = 7 and Scale = 2. In the expression window, inputPop_Y2011/Ward_Areaand We will compute population density, number of population per km2 in each ward. Repeat this step to createPop_Den16andPop_Den21, and calculate density for 2016 and 2021.
Question D: Which ward has the highest and lowest population densities in 2011, 2016 and 2021? Tabulate and also write respective population densities.
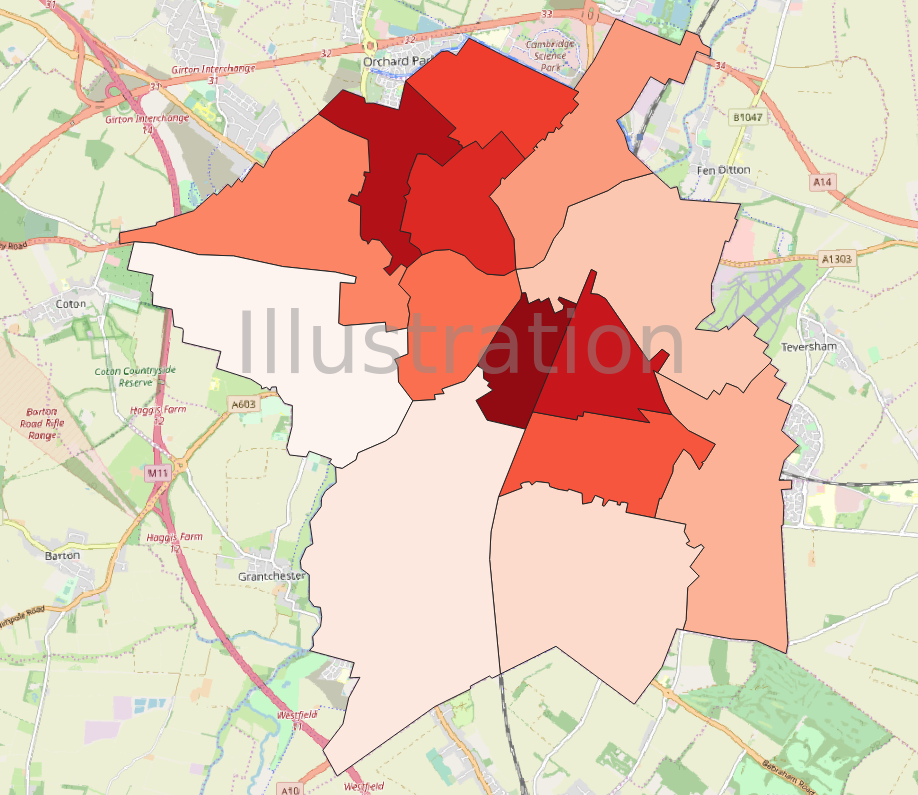
10.Symbolised cambridge map in Categorized color by Pop_Den21 (per km2) of 2021 and export the map.
Hint: nevigate to Project > Import/Export > Export Map to Image in menu bar and set Extent by Calculate from layer(Cam_City_Pop)`. Please insert the exported image into your assginment.