.png)
Choropleth Mapping
| Short Description | Choropleth Mapping helps to understand and analyze the spatial distribution and patterns of health-related determinates and outcomes within urban areas. |
|---|---|
| Data | Geospatial data (vector or raster) of health variables |
| Suggested tools | GeodaPythonQGIS |
| Category | Spatial Visualisation |
| Variable | Univariate |
Overview
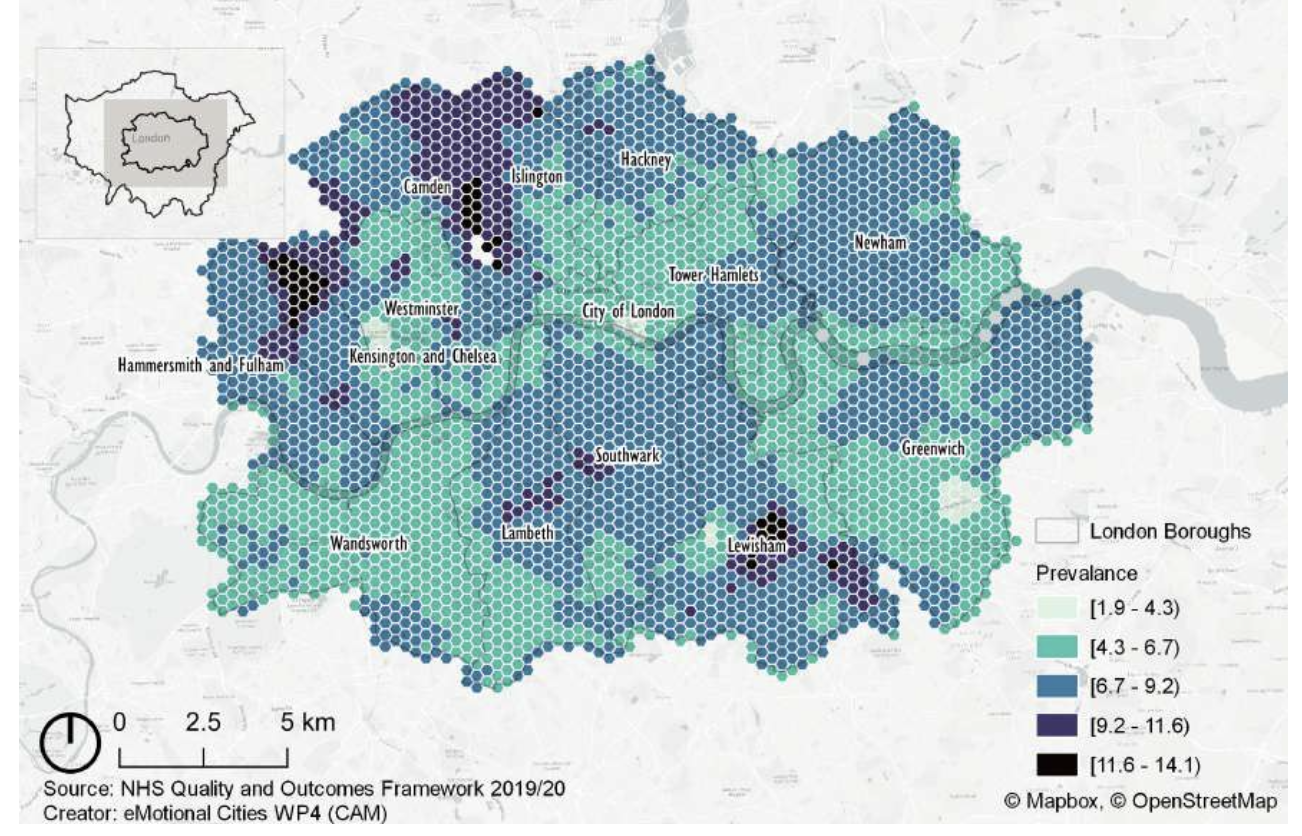
Creating a choropleth map for urban health involves visualizing health indicators or variables across different geographic regions or boundaries, such as neighborhoods, census tracts, or administrative units. The map uses color gradients or patterns to represent the variations in the health indicators across the urban area.
Description
Preprocessing spatial information
- Preparing Geographic Boundary Data: First, figure out which spatial units best fit your mapping needs. These could be neighborhoods, census tracts, administrative units, or grid networks, depending on what level of detail you require for your analysis.
- Spatial Join or Aggregation: If your geospatial data doesn't include the features (e.g., prevalence data) you need for mapping, you'll need to do a spatial join first. For data that's based on points, it's important to import and aggregate the information to a consistent spatial unit. This step ensures that your spatial analysis and mapping efforts provide meaningful insights.
Data standardisation
- Standardise the data to a common scale or distribution, allowing for fair comparisons and effective visualisation.
Visualisation and mapping:
- QGIS: use symbolisation
Classification methods for choropleth maps
💡
The choice of classification method can significantly impact the interpretation of the map and how effectively it communicates the underlying data.
- Equal Interval: The equal interval classification divides the range of data values into equal intervals. Each interval represents an equal range of values, such as 0-10, 10-20, 20-30, and so on. This method is straightforward and suitable when the data distribution is relatively uniform.
- Quantile: The quantile classification divides the data into equal numbers of observations in each class. It ensures an equal distribution of data points across classes, making it useful for avoiding biases due to extreme values or data outliers.
- Natural Breaks (Jenks): The natural breaks classification aims to find natural groupings or clusters within the data based on minimizing the variance within each class and maximizing the differences between classes. It seeks to identify distinct breakpoints that indicate significant shifts in the data distribution.
- Standard Deviation: The standard deviation classification uses standard deviation as a measure to determine class breaks. It places data values within a certain number of standard deviations from the mean into specific classes. This method can help identify areas with extreme values or outliers.
Tutorial (External)