.png)
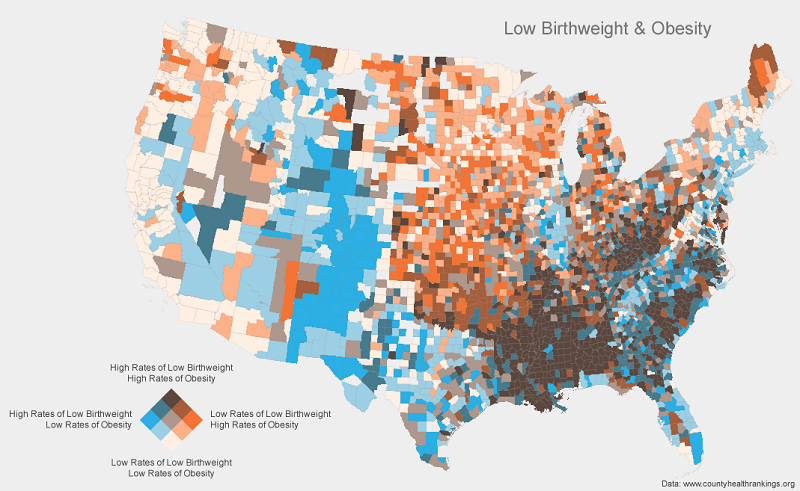
Bivariate Mapping
| Short Description | Bivariate mapping is a visualisation technique used it to visually represent two different variables on a single map. |
|---|---|
| Data | |
| Suggested tools | PythonR |
| Category | Spatial Visualisation |
| Variable |
Overview
Bivariate mapping is a visualisation technique used it to visually represent two different variables on a single map. This method combines two data layers into one map visualization, allowing for the exploration of relationships between the two variables.
In the context of urban health, bivariate mapping can be particularly useful for analyzing spatial patterns and relationships between health-related factors (e.g., disease incidence rates, access to healthcare facilities) and demographic or environmental variables (e.g., population density, pollution levels).
Applications in Urban Health and Wellbeing
- Complex Data Visualization: Bivariate maps simplify the complexity of urban health data, making it easier to identify trends, patterns, and outliers.
- Insightful Correlations: They help in uncovering potential correlations between health outcomes and environmental or social determinants, offering insights into areas that may require targeted interventions.
- Decision Support: By visualizing health disparities and resource allocations, bivariate maps support more informed decision-making in urban health planning and policy development.
- Public Engagement: These maps can be used as powerful tools for communicating health risks and determinants to the public, enhancing awareness and engagement.
Tutorial (External)
[Python]How to make bi-variate choropleth with GeoPandas and Matplotlib